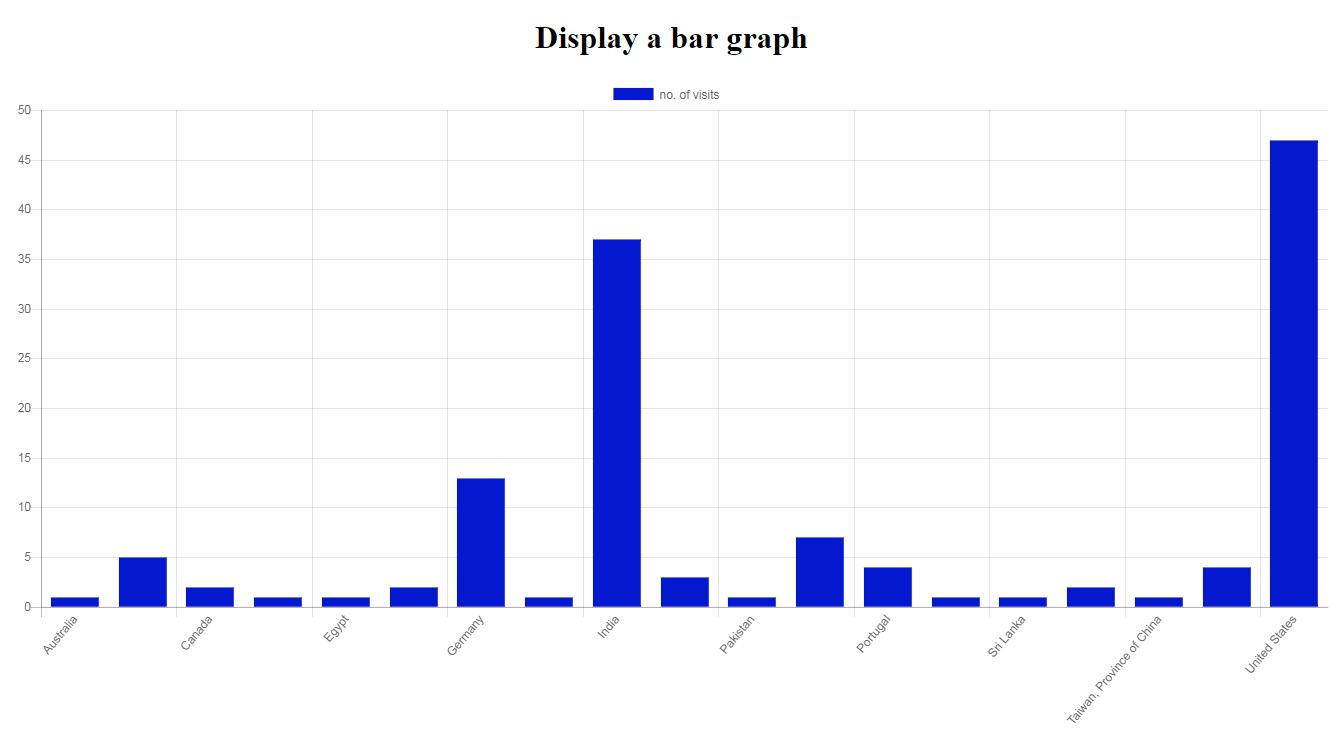
Draw a bar graph using data from database
According to Wikipedia, the definition of bar graph is as follows:
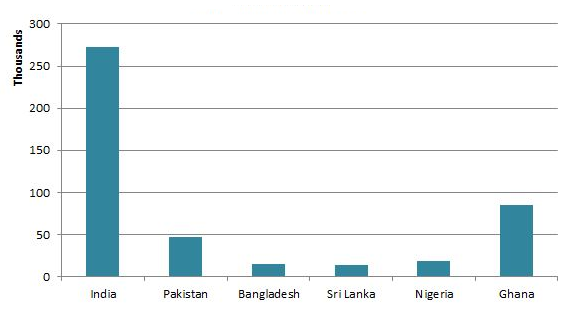
A bar chart or bar graph is a chart or graph that presents grouped data with rectangular bars with lengths proportional to the values that they represent. The bars can be plotted vertically or horizontally. A vertical bar chart is sometimes called a Line graph.
wikipedia
This tutorial covers how to draw a bar graph using the data from the MySQL database and present it in a more understandable format. For this purpose chart.js, a javascript plug-in to include responsive charts in the website. This tutorial uses PHP for server side scripting language.
Requirements
- Basic knowledge about JQuery, preferably JQuery AJAX
- Basic knowledge about server side scripting language such as PHP, JSP
- Basic knowledge about database CRUD operations
- Apache web server. For windows, you can use either XAMPP or wamp. On most linux apache is pre-installed. If not available you can download it from package manager.
- MySQL database installed (any version).
- Download chart.js from here
- Download jquery.js from here
In this tutorial, we are going to develop a project which displays a bar graph indicating the number of visitors from each country to the website.
Project Structure
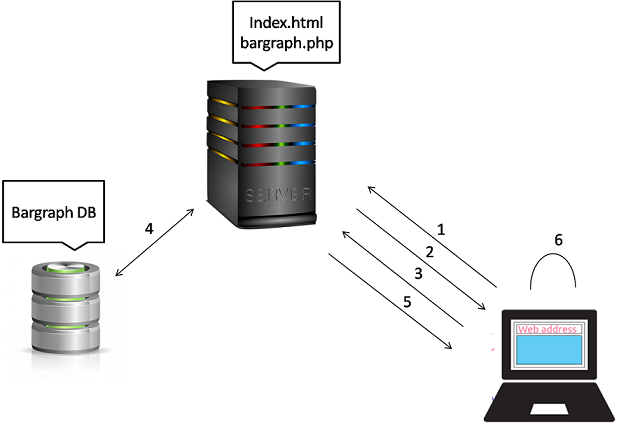
- Client makes request to server to send index.html page
- Server send index.html page to the client
- when page loads, the browser automatically makes an AJAX request to the server, passing the filename bargraph.php, to send the data from the database
- Server connects to the database and retrieve the needed data from the database
- Server packs the data in JSON and send it to the client
- AJAX after receiving the data, process it to produce the bar graph at client side.
Steps
If your are set with above requirements, let’s start with the tutorial:
-
Create a database bargraph in MySQL. Under this database, create a table named visitors with the following schema.
Column name Data type Length PageID int - Country varchar 40 After creating the above table, fill in some dummy values like PageID=2 and Country=US.
-
Create a new file with name bargraph.php at the root of your apache server and open it with your favorite editor.
- Connect to the MySQL database as follows:-
1
2
3
 <?php
     $dbc = mysqli_connect("localhost", "root", "", "bargraph") or die("error connecting to database");
 ?>
- Form a query to retrieve data from the database and execute it as follow:-
1
2
3
4
5
 <?php
      $query = "SELECT COUNT( * ) as visits , Country FROM  `visitors` GROUP BY country";

      $visitors = mysqli_query($dbc, $query) or die("error executing the query");
 ?>
The above query groups the data based on country, then count the number of rows in each group and return the count as visits along with its corresponding country name.
- Create a array to hold the rows. Retrieve rows one by one and add it to the array.
1
2
3
4
5
6
7
 <?php
       $records = array();

       while($row  = mysqli_fetch_assoc($visitors)){
          $records[] = $row;
       }
 ?>
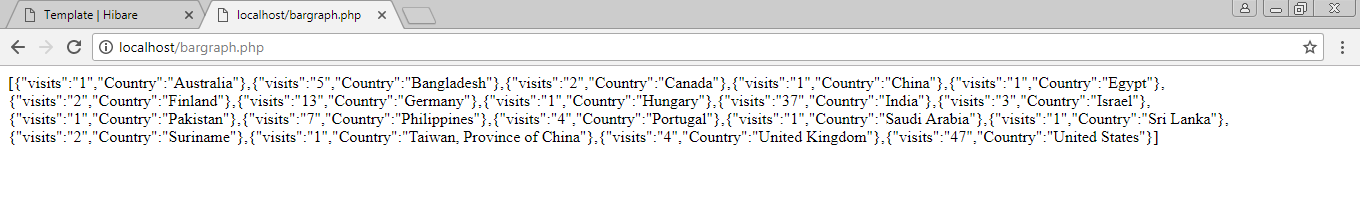
- Output the result in the form of JSON document and close the connection to database.
1
2
3
4
5
6
7
8
9
 <?php
       print(json_encode($records));

       //Clean up
       mysqli_free_result($visitors);

       //Close connection
       mysqli_close($dbc);
 ?>
The complete code will be as follow:-
1
2
3
4
5
6
7
8
9
10
11
12
13
14
15
16
17
18
19
20
21
22
23
24
25
26
27
  <?php
         //Connect to database
         $dbc = mysqli_connect("localhost", "root", "", "bargraph") or die("error connecting to database");

         //Create query to fetch the records
         $query = "SELECT COUNT( * ) as visits , Country FROM  `visitors` GROUP BY country";

         //Execute the query
         $visitors = mysqli_query($dbc, $query) or die("error executing the query");

         //Create an array to hold the records
         $records = array();

         //Retrive the records and add it to the array
         while($row  = mysqli_fetch_assoc($visitors)){
             $records[] = $row;
         }

         print(json_encode($records));

         //Clean up
         mysqli_free_result($visitors);

         //Close connection
         mysqli_close($dbc);
       mysqli_close($dbc);
 ?>
When you run the bargraph.php in the browser the result should be similar to the following:
-
Next we have to design index.html page which makes the ajax request and render the graph to the user.
-
Copy jquery.js and charts.js to files to the location where you have created file bargraph.php. Create a new file index.html at the same location and open it in your favorite editor.
- Add charts.js and jquery.js in the head section.
1
2
3
4
 <head>
     <script src="Chart.min.js"></script>
     <script src="jquery.js"></script>
 </head>
- Add a canvas element in the body section with id barChart. This is the location where the bar graph will be rendered.
1
<canvas id="barChart"></canvas>
- Now its time to write jQuery AJAX to make request to the server to send the data in JSON and then draw the graph with this data.
1
2
3
4
5
6
7
8
9
10
11
12
13
14
15
16
17
18
19
20
21
22
23
24
25
26
$(document).ready(function(){
    $.ajax({
        beforeSend: function() {
            console.log("Making AJAX request");
        },
        cache: false,
        url: 'bargraph.php',
        dataType: 'json',
        success: function(res) {
            var graphLabels = [],
                graphData = [];
            for(var i=0;i<res.length;i++){
                graphData.push(res[i].visits);
                graphLabels.push(res[i].Country);
            }
            //Make a call to the function to draw the bar graph
            drawGraph(graphLabels, graphData);
        },
        complete: function() {
            console.log("AJAX request done");
        },
        error: function() {
            console.log("Error occurred during AJAX request")
        }
    });
});
When the document is ready, the browser makes an AJAX request to the server requesting the data. It passes url bargraph.php and set dataType to json because it is expecting return data in the form of JSON. in beforeSend, complete, error it logs the status. If the request is successful, the corresponding function is executed. The variable res contains the return data in the form of JSON. The function iterates on the res variable and forms two arrays containing the name of the country and the corresponding no. of visits in graphLabel and graphData variables respectively. Then function drawGraph is called by passing these two arrays as arguments.
- The function drawGraph will be as follow:
1
2
3
4
5
6
7
8
9
10
11
12
13
14
15
16
17
18
19
20
21
22
23
24
function drawGraph(Labels, Data){
        var ctxB = document.getElementById("barChart").getContext('2d');
    var myBarChart = new Chart(ctxB, {
        type: 'bar',
        data: {
            labels: Labels,
            datasets: [{
                label: 'no. of visits',
                data: Data,
                backgroundColor:'#0318CF',
                borderWidth: 1
            }]
        },
        options: {
            scales: {
                yAxes: [{
                    ticks: {
                        beginAtZero:true
                    }
                }]
            }
        }
    });
}
In the above code, retrieve the element having id barChart. It is the location where the graph will be drawn. Next create a Chart object. It takes the element where the graph will be drawn and some other parameters. The type indicates the type of the chart to be drawn. In this case it is bargraph. labels in data is assigned to Labels array that we have created in the success function of AJAX and passed as parameter to the drawGraph function. The labels are placed on the x-axis. datasets takes array of options such as label indicating what the bars represent, tha data is assigned to the actual data value, backgroundColor is the color with which bar graph are drawn and the borderwidth is self explanatory. The options takes extra set of options.
- After completing, the complete code should like following:
1
2
3
4
5
6
7
8
9
10
11
12
13
14
15
16
17
18
19
20
21
22
23
24
25
26
27
28
29
30
31
32
33
34
35
36
37
38
39
40
41
42
43
44
45
46
47
48
49
50
51
52
53
54
55
56
57
58
59
60
61
62
63
64
65
66
67
68
69
70
71
72
<!DOCTYPE html>
<html>
    <head>
        <script src="Chart.min.js"></script>
        <script src="jquery.js"></script>
    </head>
    <body>
    <h1 style="text-align: center">Display a bar graph</h1>


    <canvas id="barChart"></canvas>
    <p>source : <a href="http://hibare.in">http://hibare.in</a></p>


    <script>
        $(document).ready(function(){
            $.ajax({
                beforeSend: function() {
                    console.log("Making AJAX request");
                },
                cache: false,
                url: 'bargraph.php',
                dataType: 'json',
                success: function(res) {
                    var graphLabels = [],
                        graphData = [];
                    for(var i=0;i<res.length;i++){
                        graphData.push(res[i].visits);
                        graphLabels.push(res[i].Country);
                    }
                    //Make a call to the function to draw the bar graph
                    drawGraph(graphLabels, graphData);
                },
                complete: function() {
                    console.log("AJAX request done");
                },
                error: function() {
                    console.log("Error occurred during AJAX request")
                }
            });
        });

        function drawGraph(Labels, Data){
            var ctxB = document.getElementById("barChart").getContext('2d');
            var myBarChart = new Chart(ctxB, {
                type: 'bar',
                data: {
                    labels: Labels,
                    datasets: [{
                        label: 'no. of visits',
                        data: Data,
                        backgroundColor:'#0318CF',
                        borderWidth: 1
                    }]
                },
                optionss: {
                    scales: {
                        yAxes: [{
                            ticks: {
                                beginAtZero:true
                            }
                        }]
                    }
                }
            });
        }

    </script>
    </body>

</html>
- when you open the index.html file in browser, the output will be displayed as follow unless there are no errors in the source code.